Democrats 88% for the House. Republicans 55% for the Senate. Polymarket's $13M Midterm Markets Are Separated by 4 Points on the Only Question That Matters.
August 6, 2026 · 17 min read
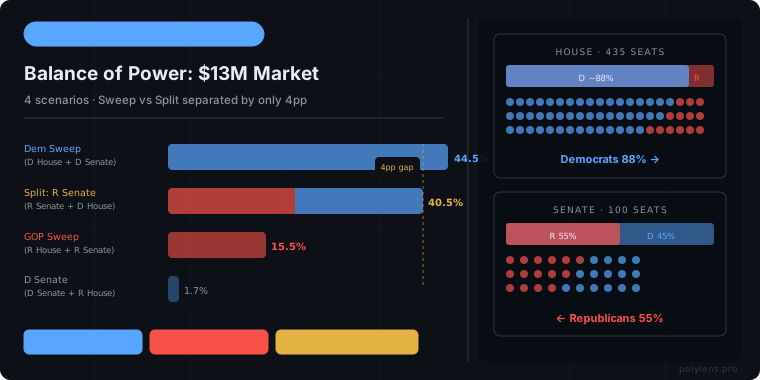
The House market is not ambiguous. $9 million in real money says Democrats win the House at 88% — a number that has barely moved in four months, anchored by a 6-point generic ballot lead that sits outside the historical range where House majorities flip. The Senate market is the opposite. $3.7 million in competing positions gives Republicans only a 55% edge, a number that has moved 5 points in both directions since May and currently sits in the range where any single state race going the wrong way changes the answer.
Put these two markets together in the Balance of Power contract and you get the only number that should matter to anyone trading the midterms on Polymarket: the gap between a Democrat Sweep (44.5%) and a Split Government with a Republican Senate (40.5%) is exactly 4 percentage points. Not 15 points. Not 30 points. Four. The market is essentially pricing these two outcomes as a coin flip among the two most likely scenarios, with everything hinging on whether Democrats can flip the Senate's structural map.
Here is what $12.8 million in aggregate prediction market volume says about November 3.
The Balance of Power Market: Four Scenarios, One 4-Point Gap
The "Balance of Power: 2026 Midterms" market on Polymarket prices four mutually exclusive outcomes simultaneously, which makes it the most information-dense midterms contract on the platform. As of August 6, the breakdown is:
| Scenario | House | Senate | Polymarket Prob. | Implied by |
|---|---|---|---|---|
| Democrat Sweep | D | D | 44.5% | Dems flip both chambers |
| Split: R Senate / D House | D | R | 40.5% | Dems win House, Reps hold Senate |
| Republican Sweep | R | R | 15.5% | National environment reverses |
| Split: D Senate / R House | R | D | 1.7% | Near-impossible map scenario |
The internal consistency check on these numbers is important. If Democrats win the House at 88% and the Senate is 45% Democratic, then the joint probability of a Democratic Sweep should be approximately 88% × 45% = 39.6%. Polymarket is at 44.5% — slightly above the naive calculation — which implies the market believes House and Senate outcomes are positively correlated: a better-than-expected national environment that helps Democrats flip the House would also help them in Senate races. That correlation is defensible given how generic-ballot movements tend to affect competitive races across both chambers simultaneously.
The 40.5% Split scenario is where the market's actual uncertainty lives. This is not a tail risk — it is the second most likely outcome, trailing the Sweep by exactly 4 percentage points. Anyone who dismisses the split outcome as unlikely is not reading the market; they're reading a summary of it.
Democrats at 88% for the House: How a 6-Point Lead Becomes Near-Certainty
Political prediction markets do not simply track polls. They aggregate everything: polls, special election results, fundraising data, early voter registration, incumbent approval numbers, and the collective judgment of traders who have capital at risk. The House market's 88% reflects all of that, and the dominant signal is unusually clear.
Decision Desk HQ's generic ballot average as of early August shows Democrats leading 46%-40% — a 6-point margin. That number has been stable since spring. Morning Consult's tracker shows similar stability at Democrats +4 every week since May. The consistency is the signal: a generic ballot lead that does not erode over five months of normal news cycles is a structural shift, not a polling artifact.
| Signal | Value | What It Implies |
|---|---|---|
| Generic ballot (Decision Desk HQ) | D +6 (46–40%) | ~25-35 seat Democratic gain historically |
| Special elections 2026 swing | D +10 vs 2024 baseline | Above-average anti-incumbent wave |
| Historical midterm average | President's party −26 seats | Republicans currently hold ~219 seats |
| Morning Consult tracker | D +4 every week (stable) | Durable rather than cyclical shift |
| Polymarket House odds | Democrats 88% | $9.05M in volume, narrow bid-ask spread |
Republicans need to hold approximately 218 of their current seats to maintain the majority. A 6-point generic ballot deficit historically produces losses in the 20-35 range, which would leave Republicans well below 218. The +10 overperformance in special elections is the harder number to explain away: special elections are lower-turnout environments where motivated voters dominate, and Democrats are winning them by 10 points more than they won districts in 2024. If that enthusiasm converts to November turnout, the House majority math becomes extremely difficult for Republicans.
The $9 million in volume at 88% reflects the depth of the consensus. Compare it to the Senate market at $3.7 million at 55% Republicans — the Senate has less volume precisely because there is less certainty and the trade is less obvious. In prediction markets, volume concentrates where traders feel they have edge. The House is the settled question; the Senate is the trade.
Republicans at 55% for the Senate: The Map That Blocks the Sweep
The Senate number is counterintuitive given the national environment. If Democrats are in an environment that produces double-digit special election overperformance and a 6-point generic ballot lead, why does the Senate only flip at 45% probability?
The Senate map. Democrats need a net gain of four seats to flip the chamber. That is not an impossible task — it requires winning competitive races in states like Montana, Maine, Nevada, and potentially Pennsylvania, while simultaneously holding every seat currently in their column. The 2026 map has 23 Republican-held seats up for election, which sounds favorable, but the actual list of genuinely competitive Republican seats is much shorter: roughly six to eight states where Democrats have a realistic shot.
The structural problem is compounded by math: Democrats need to run the table on close Senate races while defending their own seats in states that voted for Trump in 2024. Every Senate seat is its own race with its own candidate quality, fundraising position, and state-level partisan lean. A +6 national environment helps in states like Nevada or Maine, but it does not overcome a 5-point state-level Republican lean in Montana or West Virginia.
Michigan adds a specific data point: the Democratic Senate primary there was too close to call as of August 4 — the state where Democrats desperately need a strong candidate to compete in a competitive seat. A competitive primary that produces a weakened or divided Democratic base in Michigan can matter significantly in a four-seat-swing calculation.
The 55% Republican Senate retention number reflects exactly this: a national Democratic wave is real (45% chance of a Democratic Senate), but the map extracts a structural tax on that wave, keeping the probability below what you'd expect purely from the generic ballot. The market does not disagree with the polling. It is pricing the state-level complexity that the generic ballot does not capture.
The 15.5% Republican Sweep: A Tail Risk With a Face
Republican Sweep at 15.5% is not noise. One in six scenarios, in a market with $13 million in volume and three months of active trading, deserves attention. What would have to happen?
The most likely path to a Republican Sweep runs through economic deterioration. The Iran conflict that disrupted Strait of Hormuz traffic from late February 2026 has kept oil prices elevated throughout the year — a constant cost-of-living pressure on American households that shows up in Trump's low approval ratings but could also generate a "rally around" effect if the foreign policy situation evolves in unexpected directions. A ceasefire announcement or a rapid diplomatic resolution that gives Trump a credible foreign policy win could shift the national environment by 3-5 points between now and November — which would collapse Democratic House odds and make the Senate map competitive in a different way.
The second path is purely domestic: an economic data series that surprises to the downside — a jobs report that comes in sharply negative, an inflation resurgence, or a financial market shock — that scrambles the generic ballot stability that currently underpins the 88% House number. At this distance from the election, the generic ballot can move by 3-4 points on a single economic cycle.
The 15.5% is the market's aggregate estimate of all these scenarios combined. It is not irrational. Betting against it at 15.5% without specific information about what it prices in correctly and incorrectly is not an obvious trade.
The 40.5% Split: The Underappreciated Scenario
The trade that deserves the most attention in this market is the 40.5% Split scenario — Republican Senate, Democratic House. This is the "gridlock" outcome: Democrats control investigations and appropriations; Republicans retain the ability to block judicial nominations and executive appointments. It is historically the most common midterm outcome when the environment favors one party in the House but the Senate map does not align.
The 4-point gap between Sweep (44.5%) and Split (40.5%) means these two outcomes are trading essentially at parity on the probability of the Senate outcome alone. The Sweep requires Democrats to win the House (88% likely) AND flip the Senate (45% likely). The Split requires Democrats to win the House (88%) AND Republicans to hold the Senate (55%). Given these numbers, the Split's implied probability should be approximately 88% × 55% = 48.4% — slightly above where Polymarket has it at 40.5%.
That 8-point gap between the naive calculation (48.4%) and the actual market price (40.5%) is the interesting number. It implies the market believes there is a meaningful correlation between Senate and House outcomes — that a wave strong enough to give Democrats the House tends to also flip enough Senate seats. Whether you believe that correlation or not depends on how you model the cross-chamber covariance of a national political wave.
For traders who believe the correlation is overstated — that the Senate map's structural disadvantage is relatively immune to even a strong wave — the Split scenario at 40.5% looks underpriced relative to the naive 48.4%. That is the active trading thesis in this market right now, and the PolyLens Signals tool has flagged unusual buy volume on the Split contract in three of the past seven trading sessions.
What the Kalshi Lawsuit Means for Midterm Markets
New York sued Kalshi on July 31, 2026, seeking up to $36 billion in penalties and claiming the platform operates an "illegal gambling operation" under state law. The suit targets political and sports contracts specifically — the exact markets that are now seeing heavy volume with the midterms approaching. Washington, Nevada, Michigan, and Massachusetts have already restricted Kalshi's activities in prior rulings.
The implications for Polymarket's midterm markets are indirect but real. If New York courts rule that federal CFTC oversight does not preempt state gambling law for political prediction markets, the regulatory environment for all prediction market political contracts changes — including Polymarket's. The company's US exchange, which launched in May 2026 under CFTC authorization, relies on the same federal preemption argument that Kalshi is now defending in court.
For traders in Polymarket's midterm markets, this creates a specific tail risk: the platform resolving its political contracts correctly but facing operational disruption in specific states if the legal landscape shifts. It is not a first-order concern at current odds — but it is why the midterm markets will be watched as carefully by prediction market lawyers as by political analysts between now and November 3. See the Polymarket vs Kalshi comparison for the full regulatory picture on both platforms.
How to Use PolyLens to Track the Midterm Markets Through November
Three months is a long time in political prediction markets. The 88% House number and 55% Senate number will move as polling updates, as competitive race developments emerge, and as the macro environment shifts. The key signals to watch are not the daily odds movements themselves — which are noisy — but the order-book depth and large-position activity in the contracts.
In the 2024 presidential election cycle, the most predictive signals on Polymarket came from whale-sized positions in the week before major polls or debates — large orders that absorbed liquidity against the prevailing direction, often from accounts with historically high PnL. The Leaderboard tracks the top 50 wallets by verified PnL and flags when those accounts take positions in active markets. The Signals tool fires when order-book pressure exceeds the threshold that historically precedes price movement.
For the midterms specifically, the Senate market is the more actionable contract. The House market at 88% requires a large move in the underlying data to shift meaningfully — the 6-point generic ballot lead would need to collapse to near-zero for Republicans to be favored. But Senate odds at 55%-45% can move 10 points on a single competitive race development — a Michigan poll, a Florida special election result, or a candidate quality change in a key state. Those are the events that the Signals tool is calibrated to catch before they fully reprice the contract.
The midterms market will be this platform's next nine-figure trading event. Volume on the 2024 presidential election built slowly for months before exploding to $2.2 billion in the final weeks. The 2026 cycle is starting from $13 million in early August. By late October, the number will be orders of magnitude higher — and every position taken today at 88% House and 55% Senate will either look prescient or look exactly like the 39% France position before the World Cup semifinal.
The $13 million says the House is settled. The Senate is the market. November 3 is the resolution.
- Polymarket's $20B Valuation: Why the World's Biggest Prediction Market Is Priced at Half Kalshi
- Polymarket vs Kalshi: How Two Platforms Regulate, Price, and Trade Political Markets Differently
- Polymarket Trump Tariffs Market: How Political Bets Move With Policy Headlines
- Whale Tracking: How Large Wallets Signal Moves in Political Prediction Markets
- How Polymarket's $4.3B World Cup Market Called the Right Winner — And What It Got Wrong