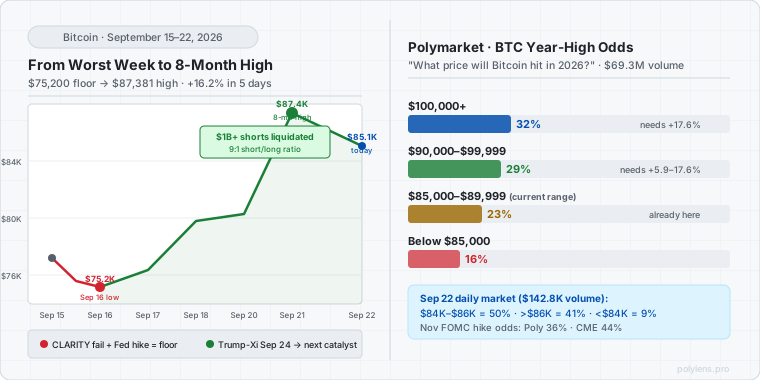
On September 16, at roughly 2:15 PM Eastern, Bitcoin printed $75,200. That was the intraday low on the day the Fed delivered its first rate hike in three years — the same day Warsh declined to submit a dot plot projection for the second consecutive meeting, the same week CLARITY failed 49-50 in the Senate. The worst-case scenario from the September 1 scenario matrix — CLARITY fail plus Fed hike — had materialized. Every bearish thesis was confirmed. The price was $75,200.
Five days later, Bitcoin touched $87,381. That is a $12,181 move, a 16.2% rally from the floor, an eight-month high. And it happened while the Fed funds rate was sitting at 3.75%–4.00%, while CLARITY was dead, while Warsh was still refusing to show his hand on the dot plot. Nothing about the macro backdrop changed. What changed was positioning.
This is the piece that prediction markets consistently underprice: the short-side crowding that builds into a consensus negative event, and the mechanical unwind that follows when the event fails to produce the feared continuation. Bitcoin bears had built their books over two weeks watching CLARITY probability collapse from 13% to zero, watching CME FedWatch race to 92%, watching CPI print +0.4%. When the hike came in at exactly 25bps and the market failed to break below $75,000 on the third attempt, the squeeze was already loaded.
The Bottom Was Right There — Three Failed Breaks Below $75,000 Built the Coil
The psychology of a short squeeze starting point is almost always the same: multiple tests of a support level that hold, accumulating short interest on each bounce, until the overhead short inventory reaches a size where any upward price move triggers a cascade of forced covers. Bitcoin tested the $75,000 level on September 15 (post-CLARITY vote), on September 16 (intraday during the Fed announcement), and briefly during Asian session on September 17. Each time, it recovered. Each failed breakdown added to the short stack sitting between $75K and $77K.
The Sunday, September 20 session saw Bitcoin at $80,300 intraday low — already $5,100 above the floor — before the squeeze proper began on Monday the 21st. The move from $80,300 to $87,000 in a single session was not driven by new buying so much as by the forced exit of sellers: approximately $454 million in Bitcoin short positions were liquidated in the first 24 hours alone, with an additional $350 million across other crypto derivatives, producing a market-wide short liquidation of roughly $782 million in that window. By the time Bitcoin hit $87,000, the 24-hour total across the cascade was over $1 billion wiped from bearish positions.
Trump-Xi on September 24 — the Catalyst the Squeeze Was Front-Running
The squeeze was mechanical, but mechanics need a reason to start. The spark, in this case, was the confirmed scheduling of a Trump-Xi summit for September 24, 2026. Trump is expected to host Xi Jinping in the United States — the first bilateral summit since the trade truce signed in May 2026. The market's reaction to the confirmation was immediate across risk assets: S&P futures, Nasdaq, oil (lower, as geopolitical risk premium receded), and most visibly Bitcoin.
The trade-geopolitical read for Bitcoin is more nuanced than "trade talks good, BTC up." The actual mechanism is through the dollar: constructive US-China signals tend to soften dollar strength, which correlates inversely with Bitcoin. Additionally, any outcome that extends or formalizes the May trade truce reduces the probability of broad tariff escalation — a scenario that has historically compressed risk appetite and pulled capital from crypto toward treasuries.
For Polymarket traders, this introduces a new variable into the November FOMC probability chain. A constructive summit outcome could soften the inflationary impact of tariffs, which would lower the CPI trajectory, which would reduce the probability of another Fed hike in November. The CME vs Polymarket divergence on November (currently 44% vs 36%) might compress further toward Polymarket's number if the summit produces a meaningful trade extension announcement.
| Date | BTC Price | Key Event | Move |
|---|---|---|---|
| Sep 15 AM | $77,200 | CLARITY vote approaching, 87% odds to fail | — |
| Sep 15 PM | $75,600 | CLARITY fails 49-50 | −2.1% |
| Sep 16 intraday low | $75,200 | Fed hikes 25bps, 12-0 | −0.5% |
| Sep 17 | $76,400 | Dead-cat bounce, third test of $75K holds | +1.6% |
| Sep 18–19 | $79,800 | Short covering begins, ETF inflows positive | +4.5% |
| Sep 20 low | $80,300 | Sunday session, squeeze loading | — |
| Sep 21 high | $87,381 | $1B+ short liquidations, eight-month high | +8.8% |
| Sep 22 (today) | ~$85,092 | Pullback, profit-taking, Trump-Xi eve | −2.6% |
Polymarket's September 22 Price Market: 50% Said $84–86K, 41% Said Higher
The "Bitcoin price on September 22?" market on Polymarket — which launched September 15 with $142,800 in total volume — resolved with a fascinating split. As of the September 22 morning session, traders had concentrated 50% probability in the $84,000–$86,000 bucket and 41% above $86,000. The sub-$84K outcome, which represented the bearish continuation thesis, was priced at only 9%.
What this tells us about Polymarket's crypto crowd: they correctly identified that the $75K floor was a floor, and they correctly assumed the rally would hold above $84K into September 22. What they underweighted was the speed of the recovery — the market pricing the $84–86K bucket at 50% on September 18-19 was already implying a $9,000 move from the floor in four days, which itself was a surprisingly bullish assumption for a crowd that had spent two weeks watching BTC get hit by macro headwinds.
The Ethereum market — "Ethereum above ___ on September 22?" — saw $111,700 in volume and showed ETH breaking above $2,800, consistent with BTC's rally. The ETH/BTC ratio held broadly stable through the squeeze, suggesting this was a broad-market risk-on move rather than Bitcoin-specific accumulation.
What 32% for $100K in 2026 Actually Says About Market Structure
The most instructive number on Polymarket's crypto markets right now is not the September 22 spot price — it's the 32% probability assigned to Bitcoin hitting $100,000 before year-end 2026. The "What price will Bitcoin hit in 2026?" market has accumulated $69.3 million in volume, making it one of the highest-liquidity crypto markets on the platform. At 32%, Polymarket traders are saying: we expect this rally to stall before $100K.
From $85,000 today, Bitcoin needs to gain another 17.6% to reach $100,000. That is roughly the same percentage move as the recovery from the September 16 low. But the timing matters — there are only about 100 days left in 2026. The August 2026 squeeze took Bitcoin from $68,000 to $77,000 in three weeks (+13%). The September squeeze added another 16% in five days. If a third catalyst emerges before year-end — a dovish Fed pivot, another major short accumulation, a geopolitical resolution — 32% is probably too low. If November brings another 25bp hike and the US-China summit disappoints, 32% might still be too high.
ETF Inflows Were Not the Story — They Were the Excuse
Multiple reports cited "strong ETF inflows" as a driver of the September rally. This is technically accurate and practically misleading. Spot Bitcoin ETF inflows in the September 18-21 window were positive — approximately $380 million net over three days — but this is not a number that mechanically moves price by $12,000. ETF inflows matter as a signal of institutional demand and as a narrative anchor for retail traders. The mechanical driver was the short squeeze. The ETF inflows were confirmation that the bid was real enough to sustain the squeeze rather than reverse it.
This distinction matters for how you interpret the Polymarket $100K market. If the rally were ETF-flow driven, it would suggest sustained institutional accumulation that could compound over weeks. If it's squeeze-driven — as the $900 million in short liquidations strongly suggest — the rally is fast but fragile. Once the short inventory is cleared, the next 10% move requires actual new buyers, not forced covers. The September 22 pullback from $87,381 to $85,092 (−2.6%) is consistent with a squeeze that has largely run its course and is now looking for a new catalyst to continue.
The Analyst Who Was Right for the Wrong Reasons and the One Who Was Right for the Right Ones
In the September 1 article in this space, the scenario matrix assigned 40.4% probability to the worst-case outcome — CLARITY fails, Fed hikes — and noted that the Bitcoin response in that scenario would likely be a sharp sell-off with an unclear floor. The floor turned out to be $75,000, tested three times without breaking. That is the kind of technical detail prediction markets cannot pre-price: whether $75,000 holds as support is not a function of the FOMC decision or the Senate vote, it's a function of where short positions are concentrated, what the ETF bid looks like, and whether market makers chose to defend that level.
The analyst camp that called for $65,000–$68,000 on a CLARITY failure plus Fed hike was right about the direction of the first move and wrong about the magnitude and sustainability. The honest answer in both cases is that the September outcome was not a function of macro analysis — it was a function of market positioning, and positioning is the variable that no model reliably quantifies in advance.
Where Polymarket Traders Are Positioned into September 24
The Trump-Xi summit is the next binary event in the calendar. November FOMC hike probability sits at 36% on Polymarket. A summit that produces a concrete trade truce extension would likely push this lower, toward 25-28%, as it would reduce the tariff-driven inflation contribution that has been one of the hawks' arguments for a second hike. A summit that disappoints — vague communiqué, no concrete framework — would probably leave November odds unchanged or drift slightly higher as the trade risk premium re-enters inflation models.
Bitcoin's current position at $85,092 is approximately 2.6% below the September 21 high. The market is in a "wait for the summit" holding pattern: the squeeze is complete, the short inventory is mostly cleared, and the next direction depends on whether September 24 delivers a risk-on surprise or a risk-neutral outcome. Polymarket's crypto crowd has placed its bets. The September 22 price market suggests they expect Bitcoin to hold the $84-86K range through the close. Whether that range becomes the base for the next leg — or the ceiling before a correction — is the question that $69.3 million in prediction market volume is currently trying to answer.