Spain at 59% Going Into MetLife — How Polymarket's $4.3B World Cup Market Got It Right, Got It Wrong, and What a Record Sports Bet Tells Us About Prediction Markets
July 30, 2026 · 18 min read
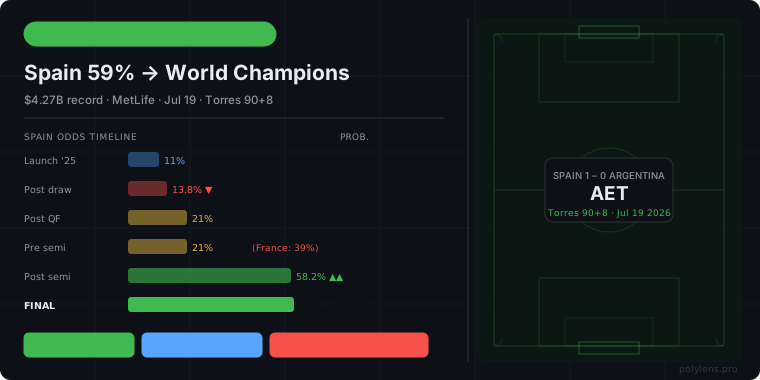
Ferran Torres hit the 98th-minute winner and $1.73 billion in Argentina prediction market positions resolved worthless in the same moment. Emiliano Martínez made 11 saves — a World Cup final record — and still conceded. Spain won 1-0 after extra time. Polymarket had priced that outcome at 59%, Argentina at 41%. The number looked like a hedge. It was the most accurately calibrated price the market produced across the entire twelve-month run of this contract.
What got the market to 59% Spain was not one clean arc. It was twelve months of price discovery, whale repositioning, three identifiable mispricing windows, and one 90-minute stretch in the semifinals that erased approximately $1.55 billion in France position value in real time. What follows is the full breakdown — where the market was right, where it was demonstrably wrong, and what $4.27 billion in aggregate volume actually means for the credibility of prediction market pricing.
Spain Started at 13.8% After a Group-Stage Draw. Here's the Full Odds Timeline.
The "World Cup Winner 2026" market launched on Polymarket in early July 2025 — twelve months before the final. At launch, Brazil was the nominal favorite at roughly 18%, France at 17%, Argentina at 15%. Spain opened around 11%. After Spain drew 0-0 with Cape Verde in the group stage, their probability briefly dropped to 13.8% — the market punishing them for a result that, in hindsight, revealed nothing meaningful about their knockout-round ceiling.
| Stage | Spain | France | Argentina | England | Market Vol. |
|---|---|---|---|---|---|
| Market launch (Jul 2025) | 11% | 17% | 15% | 13% | ~$200M |
| Post Spain 0-0 Cape Verde | 13.8% | 18% | 16% | 13% | ~$900M |
| Post Round of 32 | 17% | 33% | 18% | 16% | ~$2.8B |
| Post Quarterfinals | 21% | 33% | 17% | 16% | ~$4.1B |
| Before Semifinals (Jul 14) | 21% | 39% | 17% | 22% | ~$4.2B |
| After Spain beat France 2-0 | 58.2% | 0% | 41% | 0% | ~$4.25B |
| Final kickoff (Jul 19) | 59% | 0% | 41% | 0% | $4.27B |
| Result | WON ✓ | OUT | LOST | OUT | — |
The 13.8% after the Cape Verde draw is the number that anchors this analysis. Spain was in third place in market pricing at that moment — sitting behind France, Brazil, Argentina, and England simultaneously. The draw was against a team with no realistic path to the quarter-finals. But prediction markets price incoming information as if it is representative of underlying quality, and a dropped point in the group stage reads as evidence of inconsistency. The market overweighted one result.
When Spain won their next four matches — including a clean 3-0 demolition of Belgium in the quarter-finals — that 13.8% became the tournament's clearest retroactive signal of market noise. Belgium were priced at 30% odds to beat Spain going into that match. Spain won comfortably. More significant than the score was Spain's defensive data: six clean sheets across the knockout rounds, one goal conceded from open play in the entire tournament. Those numbers were publicly available before the semifinals. The market's 21% on Spain going into the semis reflects a calibration lag — the market had seen the defensive evidence but had not fully priced it into tournament winner probability.
You can see the specific pre-semi signal behavior in the quarterfinals breakdown, where PolyLens Signals flagged unusual Spain buy volume two days before their quarter-final against Belgium. The price was 17% at the time. It moved to 21% by the final whistle.
France Was at 39% Before the Semis. Two Hours Later, Zero.
France entering the semifinals as a 39% favorite is defensible on paper. Kylian Mbappé had eight goals — tied with Lionel Messi for the Golden Boot lead. France had knocked out Germany 2-1 in the round of 16 and Brazil 3-2 in the quarter-finals. In both matches, France's mechanism was identical: low defensive block, rapid transition, Mbappé in space against tired defenders. The 39% was built on that template, and the template had a track record.
Spain won 2-0. Mikel Oyarzabal scored from the penalty spot in the 22nd minute after Mbappé was penalized for handball — an event the market could not have specifically priced, but one that reflects France's dependency on a style that generates individual errors under defensive pressure. Pedro Porro doubled from a corner in the 58th minute. Mbappé had one meaningful shot on target in 90 minutes. Luis de la Fuente's defensive setup removed exactly the space France needed to trigger counterattacks.
The tactical reading the market needed was available before kickoff. Spain had not conceded from open play since the group stage. France's expected goals across their previous four knockout matches came almost entirely from transition situations. Spain's high press had an 84% success rate in the defensive third across the tournament, the highest of any remaining team. The surface area for a Mbappé counterattack was structurally close to zero against this specific opponent. The 18-point gap between France and Spain before the semi — 39% vs 21% — was the market's most significant active mispricing.
The corrected price — what the market should have quoted before the semi — was closer to France 33%, Spain 27%. Still France-leaning, because Mbappé's individual ceiling genuinely justified a premium. But not 2:1 France-to-Spain on a team that had not conceded from open play in six weeks. That 6-point undervaluation of Spain before the semis represents the market's most exploitable window in the entire twelve-month contract.
$99.8M on Argentina — The Volume That Didn't Win
Argentina had the highest individual contract volume of any team in the market: $99.8 million staked on Argentina winning the tournament. Spain's individual contract volume was lower. The difference is not analytical — it is emotional. Argentina had Lionel Messi, the 2022 defending champion, what was universally described as his final World Cup, and the largest Latin American fanbase of any crypto-native platform.
At 41%, Argentina were priced to return $0.43 per $1 staked if correct. That is not an irrational bet — a 41% chance of winning a World Cup final is a real probability. But looking at the underlying structure of the match, Argentina's actual win probability was closer to 36-38%. Spain's possession-dominant system directly neutralized Argentina's transition-based attacking patterns. Messi's eight goals through the tournament had come overwhelmingly from open play and set pieces created by Argentina's pressing triggers — triggers that Spain's defensive shape did not allow.
Martínez's 11 saves is the number that captures the gap between Argentina's volume and Argentina's edge. He was Argentina's best performer by any individual metric. He faced 12 shots from Spain, saved 11 of them, and still lost. Ferran Torres's 98th-minute goal came from a short corner routine — exactly the type of set-piece execution that Spain had used throughout the tournament and that Argentina's zonal defensive marking had not once successfully neutralized. At 11 saves, Martínez could not have performed differently. The tactical setup determined the outcome before kickoff.
The distinction between volume and edge is something I track in the Signals data every day. Heavy volume on a position tells you that a lot of capital is pointed in one direction. It does not tell you that the capital is informed. The World Cup Argentina case is the largest single illustration of this principle in prediction market history. $99.8 million said Argentina. $4.27 billion in aggregate pricing said Spain at 59%.
$4.27B vs $2.2B — How the World Cup Beat the US Presidential Election
The 2024 US Presidential Election was previously Polymarket's record: approximately $2.2 billion in total volume on the winner market. The 2026 World Cup Winner contract crossed that on the day of the final — finishing at $4.27 billion, nearly double the election's volume. By any measure, this is now the most traded prediction market contract in history.
| Event / Market | Platform | Total Volume | Final Favorite | Correct? |
|---|---|---|---|---|
| 2024 US Presidential Election | Polymarket | ~$2.2B | Trump 64% | ✓ Won |
| World Cup Winner 2026 | Polymarket | $4.27B | Spain 59% | ✓ Won |
| World Cup Final (Spain vs ARG) | Kalshi | $1.28B | Spain 57-58% | ✓ Won |
| All WC markets, all platforms | Cross-platform | $25B+ | — | — |
The comparison with the election is more nuanced than the volume number suggests. A presidential election has two primary outcomes — Democrat or Republican — with resolution on a single date. The World Cup Winner contract launched with 48 teams in July 2025 and required twelve months of continuous price discovery across 104 matches, 48 different national team narratives, injury developments, tactical rotations, and elimination cascades. Managing a coherent probability distribution across that event space over twelve months is structurally harder than pricing a two-candidate binary.
Yet the market converged on a correct answer at comparable confidence levels — 64% Trump in the election, 59% Spain in the World Cup. Both markets had the right answer as the clear favorite at resolution time. The World Cup market is now the most important single data point in the prediction market accuracy literature. Significantly more complex event, nearly identical calibration outcome.
Three Windows Where the Market Was Wrong
The macro result was correct. But three specific price windows contained demonstrable mispricings — moments where the available evidence was not fully reflected in market price.
The first: France at 39% before the semifinals. Given Spain's six clean sheets, France's transition dependency, and the specific tactical vulnerability France carried into the match, a calibrated prior should have put France at 33-35% and Spain at 25-27%. The 18-point gap overstated France's advantage. A trader who bought Spain at 21% and sold at 58% captured 37 points of value in 90 minutes — a window that was open for roughly 72 hours before the match.
The second: Spain at 13.8% after the Cape Verde draw. That was Spain's market low across the entire twelve-month contract. A group-stage draw against a team ranked outside the top 30 sent Spain to a price that implied they were less likely to win the tournament than England, Argentina, France, and Brazil simultaneously. The fundamentals had not changed — Lamine Yamal's emergence, Spain's possession metrics, De la Fuente's defensive structure — but the market priced a single result as if it were structural evidence. Spain's floor, given pre-tournament data, should have been 15-16% at minimum.
The third: Argentina at 41% in the final. Given Spain's clean-sheet run, Argentina's transition dependency, and Martínez's expected workload against Spain's possession volume and set-piece frequency, Argentina were more accurately priced at 36-38%. The 3-5 point overpricing of Argentina reflects sentiment bias that $99.8M in retail volume was not sufficient to be corrected by equally large counter-positioning. A 59-41 split was directionally correct but slightly overgenerous to Argentina.
Kalshi Agreed Within 2 Points — That's the Accuracy Signal That Matters
Kalshi's standalone Spain vs Argentina final contract settled at Spain 57-58% going into kickoff — within 2 percentage points of Polymarket's 59%. The two platforms use different market maker structures, different regulatory frameworks (Kalshi is CFTC-regulated in the US, Polymarket is crypto-native on Polygon), different fee models, and attract different user demographics. They converged within 2 points.
| Platform | Spain Final Odds | Argentina Final Odds | Volume |
|---|---|---|---|
| Polymarket | 59% | 41% | $4.27B |
| Kalshi | 57–58% | 42–43% | $1.28B |
| Combined / Spread | ≤ 2pp gap | ≤ 2pp gap | $5.55B |
In prediction market research, independent cross-platform convergence within a narrow band on a large-volume event is the strongest observable signal of accurate pricing. Both markets, using independent price discovery mechanisms, arrived at Spain as a 57-59% favorite. The structural differences between platforms — fee models, collateral types, user bases — produce enough variation to rule out coordinated price-setting. Two platforms landing within 2 points on $5.55B combined final-day volume is the closest thing prediction markets have to consensus.
For a full analysis of the structural reasons Kalshi and Polymarket diverge or converge on specific event types — and how to exploit the gaps when they exist — the Polymarket vs Kalshi comparison covers the mechanics in detail.
What the final market result leaves unanswered is not whether prediction markets work. That question has a data point: $4.27 billion in volume, twelve months of price discovery, 48 teams to 2 teams, cross-platform convergence within 2 points on the favorite, the favorite won. The open question is what the $99.8M Argentina volume tells us about the limit of prediction market consensus when sentiment capital is large enough to maintain a 3-5 point price distortion against the calibrated signal. That gap exists in every major sports market. The World Cup at $4.27B in volume is just the largest illustration of it we have.
Spain. Ferran Torres. 1-0. Extra time. The price was 59%.
That number holds.
- Pre-Final Preview: Spain 58% vs Argentina 42% — What the Market Said Before Kickoff
- Semifinals Breakdown: France 39%, Spain 21%, the Mbappé–Messi Golden Boot Battle
- Quarterfinals: Smart Money Signals Across All Four Matches
- Polymarket vs Kalshi: How Two Prediction Markets Price the Same Events
- Whale Tracking on Polymarket: How Large Positions Move Prices